plot_121 plot 1 to 1 line to examine linearity
plot_121(df, xvar, yvar, color = NULL, labx = NULL, laby = NULL, ...)Arguments
- df
a dataframe, include columns xvar and yvar
- xvar
unquoted variable for colmun name for x axis, should be categorical
- yvar
unquoted variable for column name for y axis, should be numeric
- color
`NULL`, unquoted variable for colmun name for group
- labx
string for x axis title, default is xvar.
- laby
string for y axis title, default is yvar
Value
a ggplot with 1:1 line
Examples
pacman::p_load(ggplot2,toolPhD,ggpmisc)
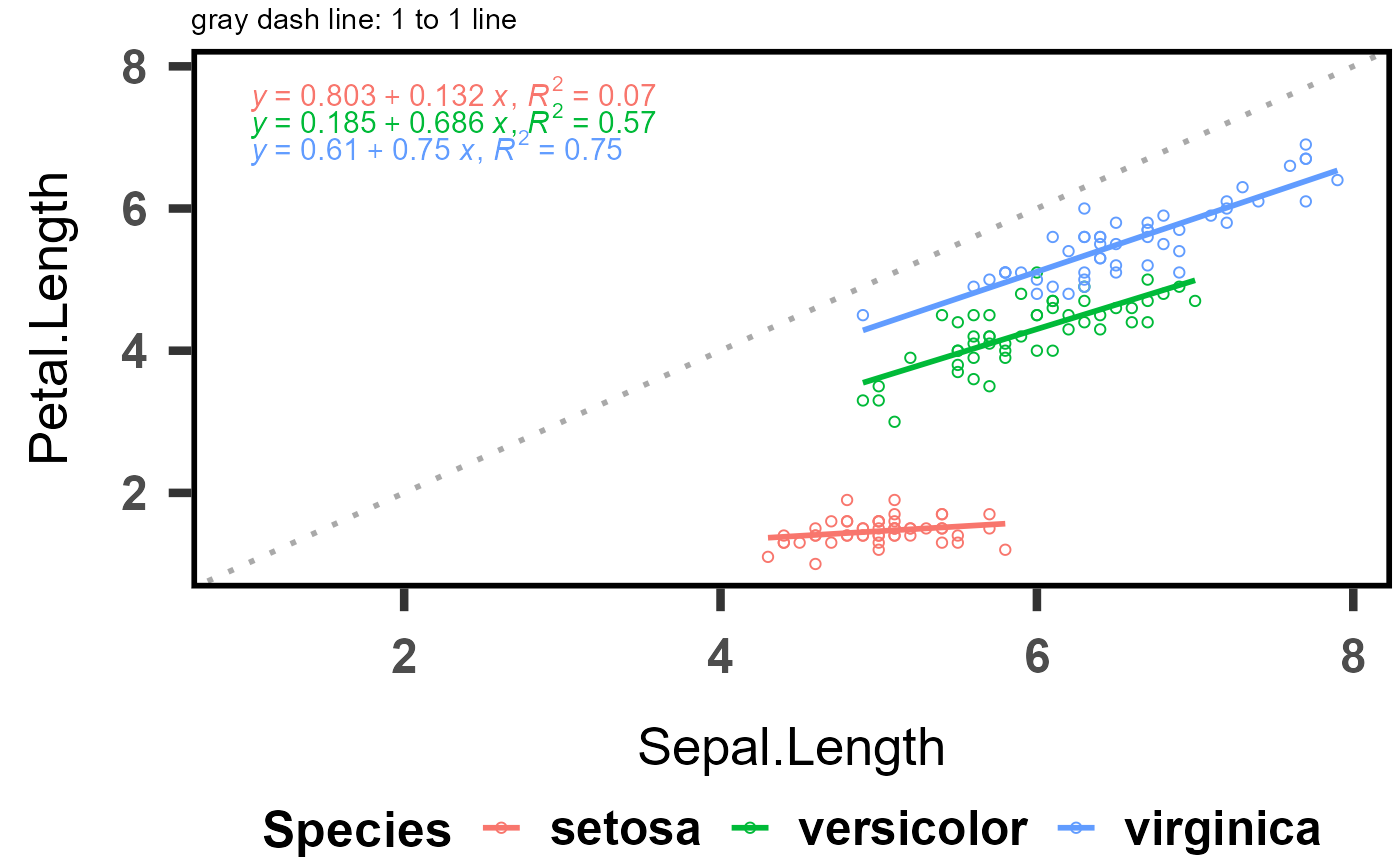
plot_121(iris,Sepal.Length,Petal.Length,color=Species)
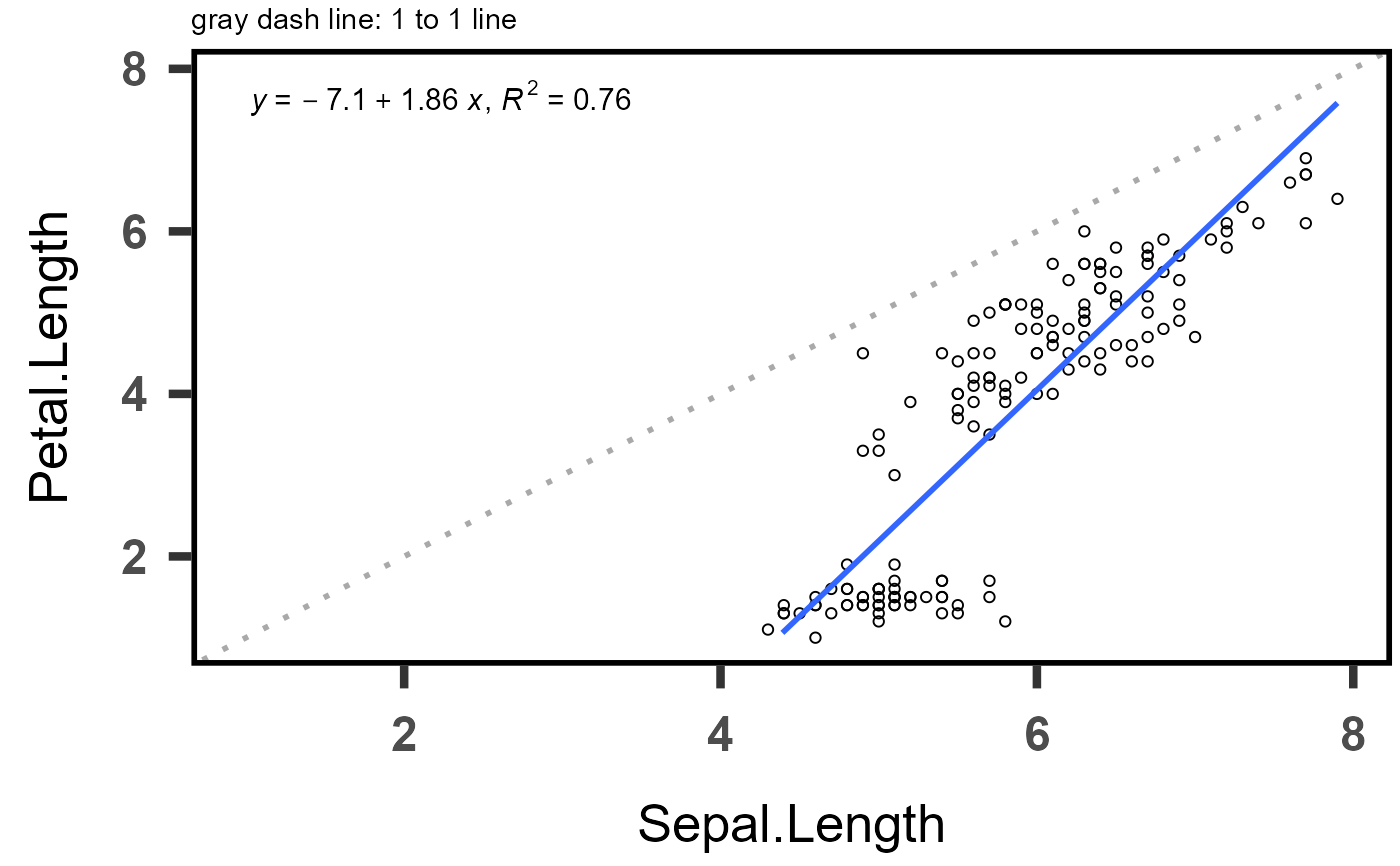
 plot_121(iris,Sepal.Length,Petal.Length)
#> Warning: Removed 2 rows containing missing values or values outside the scale range
#> (`geom_smooth()`).
plot_121(iris,Sepal.Length,Petal.Length)
#> Warning: Removed 2 rows containing missing values or values outside the scale range
#> (`geom_smooth()`).