sma_plot plot sma correlation analysis add regression line and add r2
sma_plot(datf, xvar, yvar)Arguments
- datf
a dataframe, include columns x and y
- xvar
unquoted string for column name x
- yvar
unquoted string for column name y
Value
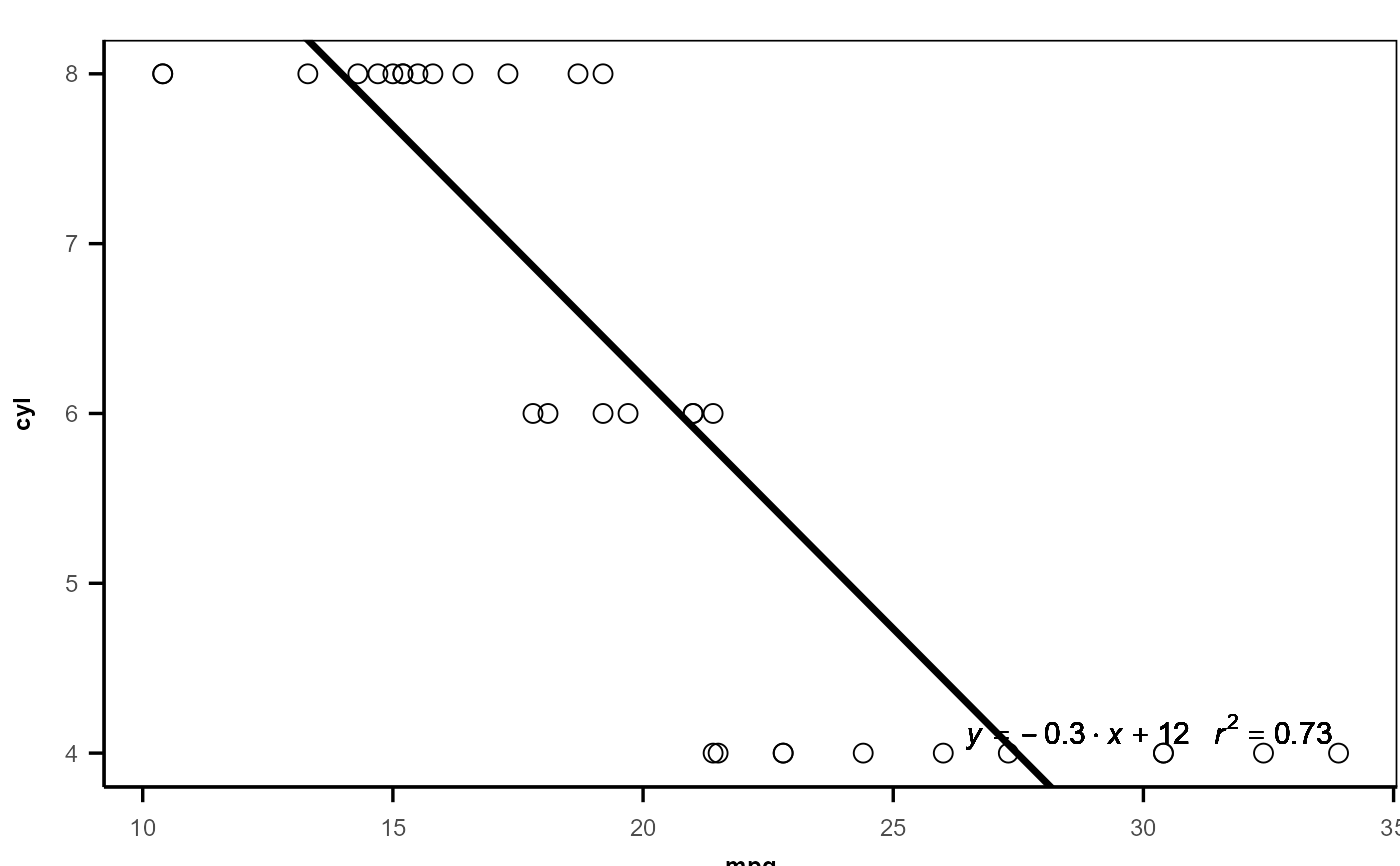
a ggplot with regression line and r2 text
Examples
sma_plot(mtcars,xvar=mpg,yvar = cyl)
#> Warning: All aesthetics have length 1, but the data has 32 rows.
#> i Please consider using `annotate()` or provide this layer with data containing
#>   a single row.