violin_plot plot distribution of numeric y over categorical x
violin_plot(df, xvar, yvar, orderx = F, labx = NULL, laby = NULL, ...)Arguments
- df
a dataframe, include columns xvar and yvar
- xvar
unquoted variable for colmun name for x axis, should be categorical
- yvar
unquoted variable for column name for y axis, should be numeric
- labx
string for x axis title, default is xvar.
- laby
string for y axis title, default is yvar
- oderx
logical, default is FALSE, if TRUE, order the x axis based on y.
Value
a ggplot with violin plot
Examples
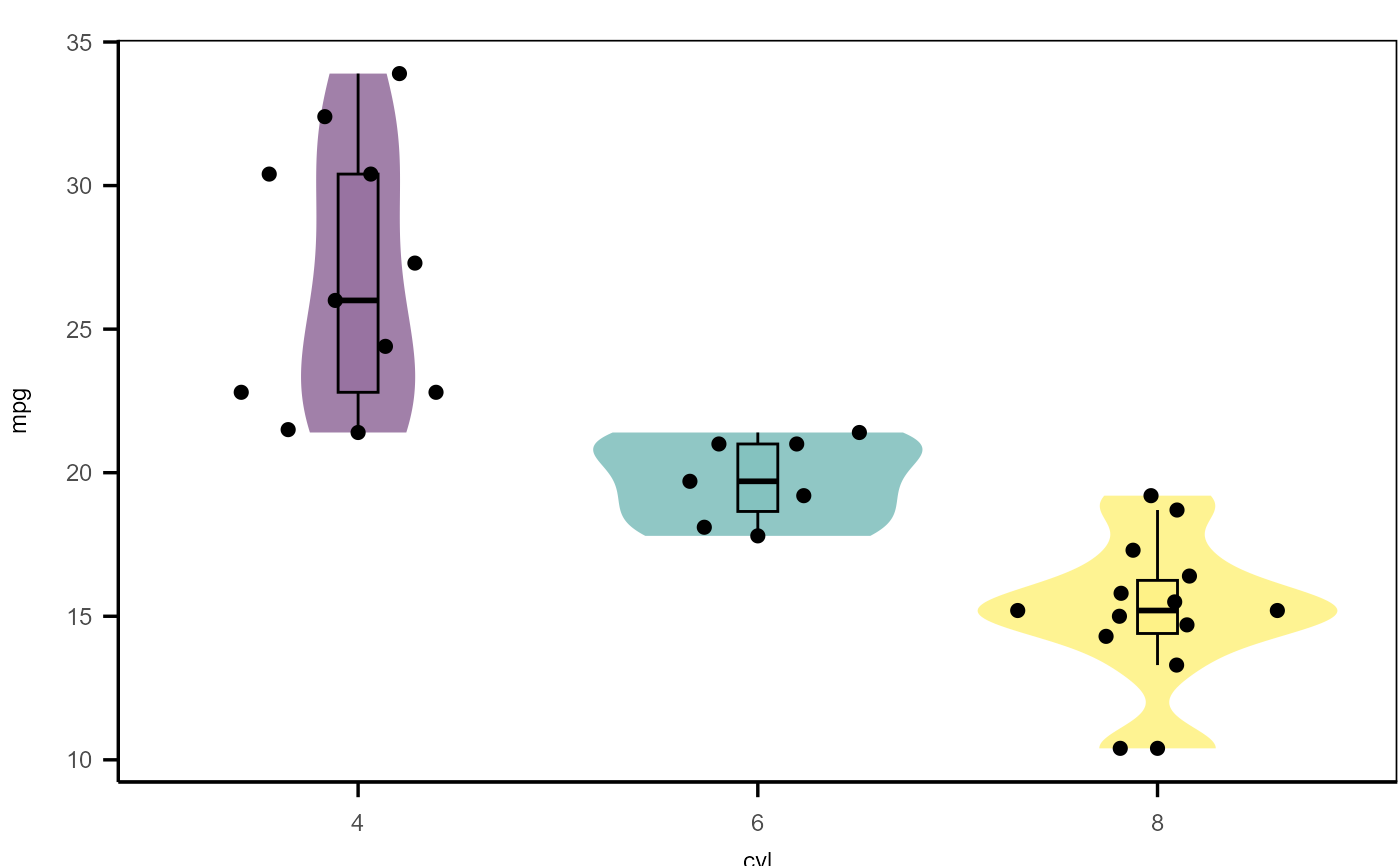
violin_plot(mtcars,cyl,mpg,orderx=T)
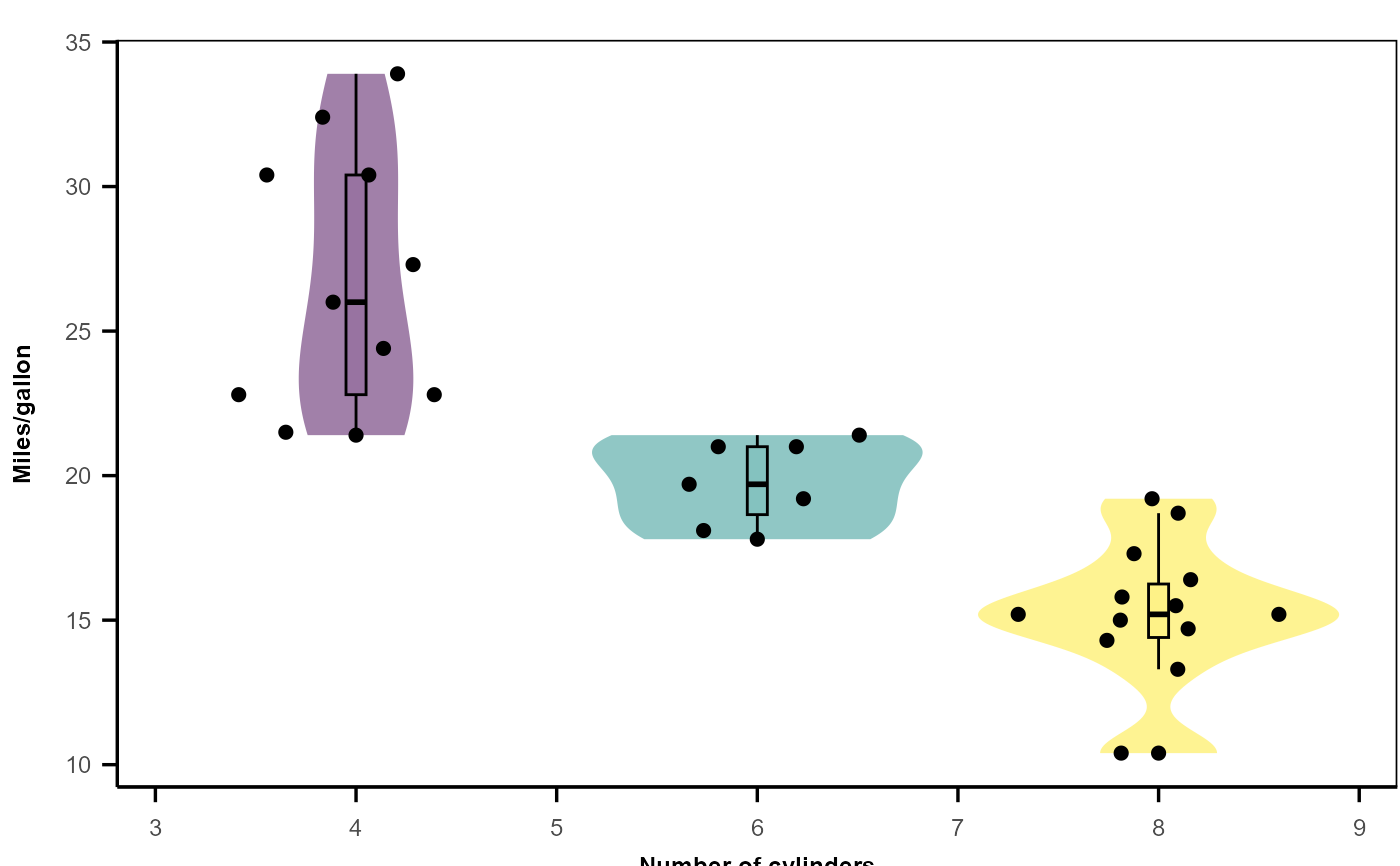
 violin_plot(mtcars,cyl,mpg,labx="Number of cylinders",laby="Miles/gallon")