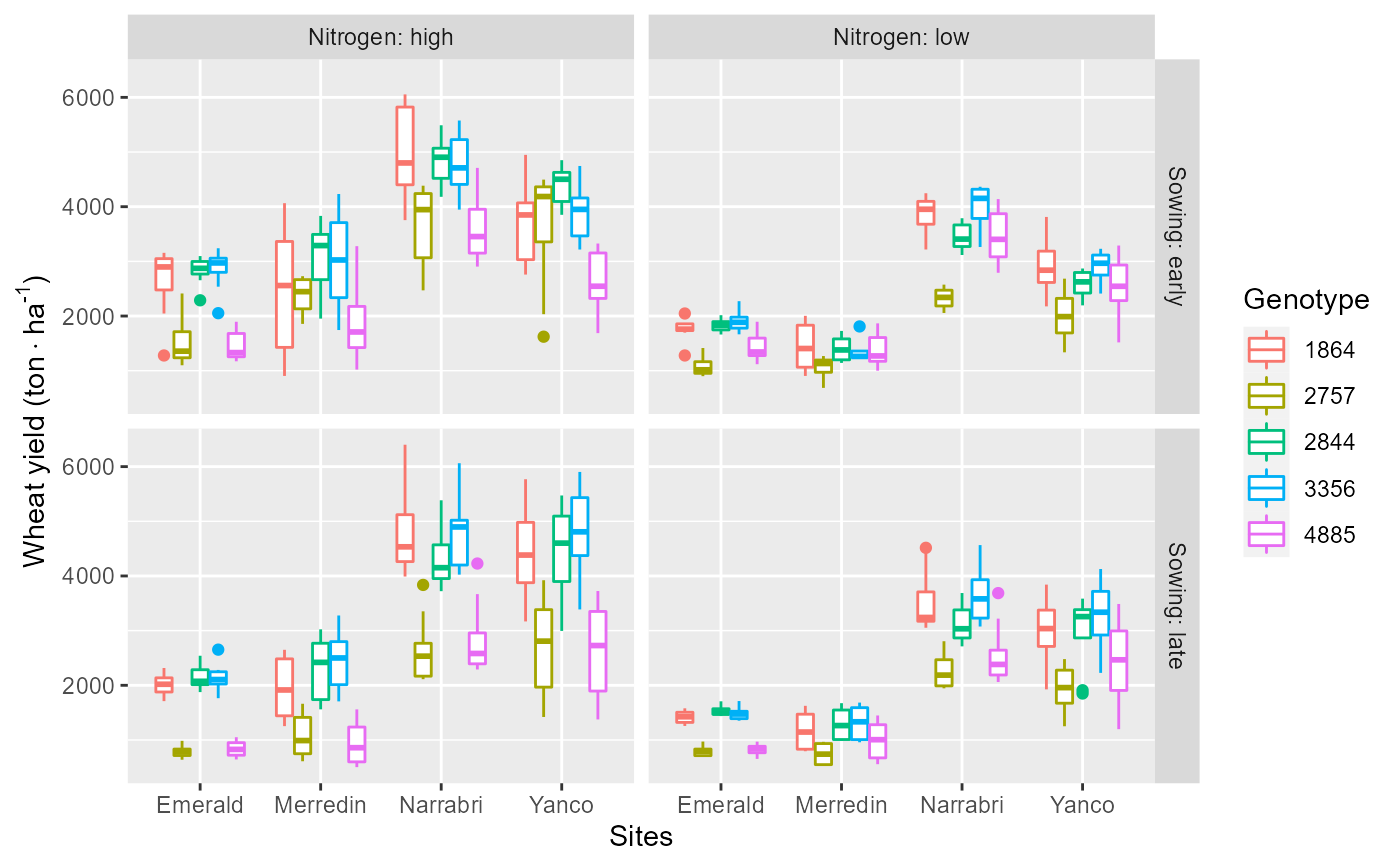
Multi-environment trail evaluating 5 genotypes in 4 locations for 4 years, with 2 nitrogen application rates, 2 sowing dates, and 2 CO2 levels of treatments (Casadebaig et al., 2016).
data(Data)Format
A dataframe with 640 observations on the following 8 variables.
Yieldunit: kg*ha^-1.Genotypegenotypes, 5 varieties.Environment128 unique combination of environments for each genotype.Year4 years.Sites4 locations.Nitrogen2 nitrogen application levels.CO22 CO2 concentration levels.Sowing2 sowing dates.
References
Casadebaig P, Zheng B, Chapman S, Huth N, Faivre R, Chenu K (2016). “Assessment of the Potential Impacts of Wheat Plant Traits across Environments by Combining Crop Modeling and Global Sensitivity Analysis.” PLOS ONE, 11(1), e0146385. doi: 10.1371/journal.pone.0146385 .
Examples
data(Data)
# \donttest{
ggplot2::ggplot(Data,ggplot2::aes(x=Sites,y=Yield,col=Genotype))+
  ggplot2::geom_boxplot()+
  ggplot2::facet_grid(Sowing~Nitrogen,labeller =ggplot2::label_both)+
  ggplot2::ylab(bquote('Wheat yield (ton' %.%'ha'^'-1'*')'))

# }
# }